Change Detection Tutorial
Tutorial for running change detection algorithms.
This is done using randomly generated before and after images.
Steps: 1. generate base DEM 1. create after DEM by filling depressions (use defaults for now) 1. add craters to after image (use defaults for now) 1. hillshade both images (use azi param to control light direction) 1. apply noise to both images 1. apply affine to both images and use after affine on truth data (stick with offset differences for now, as it tends to be the most common registration error) 1. run before and after through a CD algorithm 1. compute TPR and FPR * TPR = TP/TP+FP * FPR = FP/FP+TP * IF function returns points, TP = point equals to or is contained by set of “truth” points/polys 1 pixel buffer. * ELSE function returns polygons, TP = polygon has >50% intersection with “truth” poly.
[1]:
import warnings
warnings.filterwarnings("ignore")

import os
os.environ['ISISROOT'] = '/usgs/cpkgs/anaconda3_linux/envs/isis3.9.0'

from numpy import random
from scipy.ndimage.interpolation import zoom
import scipy

import os
import math

from PIL import Image
import numpy as np
from scipy.misc import imresize

import shapely
from shapely.geometry import Point, MultiPolygon, MultiPoint

import matplotlib
import matplotlib.pyplot as plt
import matplotlib.image as mpimg

import pandas as pd
import geopandas as gpd

from autocnet.utils.utils import bytescale, cartesian
from autocnet.examples import get_path
from autocnet.cg import change_detection as cd
from autocnet.cg import cg

# used just to produce parameterizations
def cartesian_product(*arrays):
    la = len(arrays)
    dtype = "object"
    arr = np.empty([len(a) for a in arrays] + [la], dtype=dtype)
    for i, a in enumerate(np.ix_(*arrays)):
        arr[...,i] = a
    return arr.reshape(-1, la)
[2]:
def generate_before_and_after(azi=(190, 190), noise_stddev=(0,0), alpha=1.0, nboulders=5):
# Generate base DEM
before_dem = cd.generate_dem(alpha=alpha)
# Generate Boulders
before_dem, before_polys, after_dem, after_polys = cd.generate_boulder_field(before_dem, nboulders)
# compute Depressions
after_dem, change_poly = cd.compute_depression(after_dem, alpha=0.3, return_polygon=True)
change_poly = shapely.ops.cascaded_union([change_poly, MultiPolygon(after_polys), MultiPolygon(before_polys)])
# hillshade
before_image = cd.hillshade(before_dem, azi=azi[0]).mean(axis=2)
after_image = cd.hillshade(after_dem, azi=azi[1]).mean(axis=2)
# add noise
before_image += np.random.normal(0, noise_stddev[0], before_image.shape)
after_image += np.random.normal(0, noise_stddev[1], after_image.shape)
# TODO: Add affine distortion
return before_image, after_image, change_poly
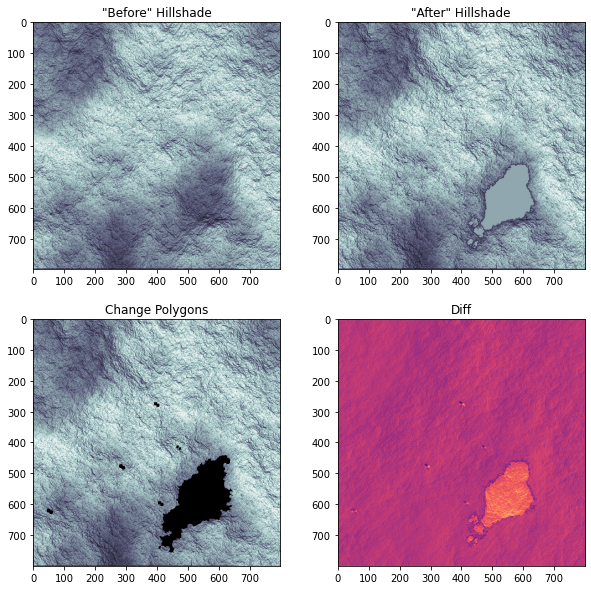
def plot_before_after_image(before_image, after_image, change_poly):
diff = (after_image-before_image).astype(float)
fig, axs = plt.subplots(2,2, figsize=(10,10))
axs[0][0].imshow(before_image, cmap="bone")
axs[0][0].set_title('"Before" Hillshade')
axs[0][1].imshow(after_image, cmap="bone")
axs[0][1].set_title('"After" Hillshade')
axs[1][0].imshow(after_image, cmap='bone')
if isinstance(change_poly, MultiPolygon):
for geom in change_poly.geoms:
xs, ys = geom.exterior.xy
axs[1][0].fill(ys, xs, alpha=1, fc='black', ec='none')
else:
xs, ys = change_poly.exterior.xy
axs[1][0].fill(ys, xs, alpha=1, fc='black', ec='none')
axs[1][0].set_title("Change Polygons")
axs[1][1].imshow(diff, cmap="magma")
axs[1][1].set_title('Diff')
plt.show()
def compute_cd_metrics(results, function_params, verbose=False):
ny = len(results)
if verbose:
fig, axs = plt.subplots(ny, 1)
fig.set_figheight(5*ny)
fig.set_figwidth(5)
truth_poly = change_poly.buffer(1)
scoresDf = pd.DataFrame(index=[str(p) for p in function_params], columns=["tpr", "fpr", "geom"])
for i, coord in enumerate(results):
res = results[i]
df = res[0]
# get true positives and false negatives
true_positives = 0
if(df.shape[0] is not 0 and isinstance(df.geometry[0], Point)):
# needs to be within one pixel of truth
for p in df.geometry:
p = Point(p.y, p.x)
if p.intersects(truth_poly):
true_positives+=1
else:
# geopandas likes to swap x,y
sdf = df.geometry.map(lambda polygon: shapely.ops.transform(lambda x, y: (y, x), polygon))
# get true positives and false negatives
true_positives = 0
for geom in sdf.geometry:
for truth_geom in truth_poly.geoms:
if geom.intersection(truth_geom).area >= geom.area/5:
true_positives += 1
break
print(true_positives, len(truth_poly))
false_positives = len(df) - true_positives
TPR = max(true_positives/len(df) if df.shape[0] is not 0 else np.nan, 1)
FPR = false_positives/len(df) if df.shape[0] is not 0 else np.nan
scoresDf.loc[str(function_params[i])]["tpr"] = TPR
scoresDf.loc[str(function_params[i])]["fpr"] = FPR
if df.shape[0] is 0:
scoresDf.loc[str(function_params[i])]["geom"] = None
else:
try:
scoresDf.loc[str(function_params[i])]["geom"] = MultiPoint(df.geometry)
except:
scoresDf.loc[str(function_params[i])]["geom"] = MultiPolygon(list(df.geometry))
if verbose:
axs[i].set_title(f"score: {TPR}")
axs[i].set(xlabel=f"", ylabel=f"")
axs[i].imshow(after_image, cmap="bone", alpha=0.2)
if isinstance(truth_poly, MultiPolygon):
for geom in truth_poly.geoms:
xs, ys = geom.exterior.xy
axs[i].fill(ys, xs, alpha=0.5, fc='black', ec='none')
else:
xs, ys = truth_poly.exterior.xy
axs[i].fill(ys, xs, alpha=0.5, fc='black', ec='none')
try:
axs[i].scatter(df.x, df.y, c="r", alpha=1, s=1)
except:
df.plot(ax=axs[i])
if verbose:
plt.show()
return scoresDf
Generate before and after images
[3]:
before_image, after_image, change_poly = generate_before_and_after(azi=(190, 215), noise_stddev=(1,2))
plot_before_after_image(before_image, after_image, change_poly)
Warning! No geotransform defined. Choosing a standard one! (Top left cell's top let corner at <0,0>; cells are 1x1.)
Warning! No geotransform defined. Choosing a standard one! (Top left cell's top let corner at <0,0>; cells are 1x1.)
Warning! No geotransform defined. Choosing a standard one! (Top left cell's top let corner at <0,0>; cells are 1x1.)
Warning! No geotransform defined. Choosing a standard one! (Top left cell's top let corner at <0,0>; cells are 1x1.)
Warning! No geotransform defined. Choosing a standard one! (Top left cell's top let corner at <0,0>; cells are 1x1.)
OKB
Simple change detection algorithm which produces an overlay image of change hotspots (i.e. a 2d histogram image of detected change density). This is done by running a ORB feature extractor over a diff or ratio image.
Cons 1. Fails when change near edges of image 2. Not robust to textured FPs, lighting differences 3. Cannot capture large, uniform, changes 4. Poor automatic change detection, incabable of determining descrete changes 5. If nfeatures is too high, noise in the image begins to be picked up as FPs.
Pros 1. Simple, fast 2. Good “quick glance” change detection
Generate CD parameters
[4]:
# Change these based on algorithm

nfeatures = [1000, 2000]
scalefactor = [1.5]
nlevels = [3]
function_params = [dict(zip(["nfeatures", "scaleFactor", "nlevels"], ps)) for ps in cartesian_product(nfeatures, scalefactor, nlevels)]

print(f"{len(function_params)}X1 Matrix")
2X1 Matrix
Run OKB with Params
[5]:
def image_diff_abs(arr1, arr2):
     return np.abs(cd.image_diff(arr1, arr2))

results = [cd.okubogar_detector(before_image,
                                after_image,
                                nbins=50,
                                extractor_kwargs=params) for params in function_params]
Plot results
[6]:
okb_results = compute_cd_metrics(results, function_params, True)
okb_results
984 6
1780 6
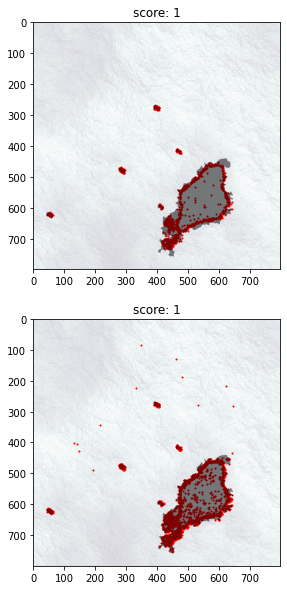
[6]:
| tpr | fpr | geom | |
|---|---|---|---|
| {'nfeatures': 1000, 'scaleFactor': 1.5, 'nlevels': 3} | 1 | 0.016 | (POINT (533 649), POINT (538 494), POINT (455 ... |
| {'nfeatures': 2000, 'scaleFactor': 1.5, 'nlevels': 3} | 1 | 0.0198238 | (POINT (441 668), POINT (454 668), POINT (458 ... |
OKBM
Modified version of OKB, apply clustering to the output of OKB in order to identify contiguous globs.
Generate CD Parameters
[14]:
# Change Based on Algorithm
nfeatures = [500, 2000]
scalefactor = [1.5]
nlevels = [3]
extractor_params = [dict(zip(["nfeatures", "scaleFactor", "nlevels"], ps)) for ps in cartesian_product(nfeatures, scalefactor, nlevels)]

min_samples = [10]
max_eps = [20]
xi = [.5]
eps = [.5]
cluster_params =  [dict(zip(["min_samples", "max_eps", "eps", "xi"], ps)) for ps in cartesian_product(min_samples, max_eps, eps, xi)]

print(f"{len(cluster_params)}X{len(extractor_params)} Matrix")
function_params = cartesian_product(extractor_params, cluster_params)
1X2 Matrix
[15]:
results = [cd.okbm_detector(before_image,
                   after_image,
                   extractor_kwargs=params[0], cluster_kwargs=params[1]) for params in function_params]
[16]:
okbm_results = compute_cd_metrics(results, function_params, True)
okbm_results
7 6
6 6
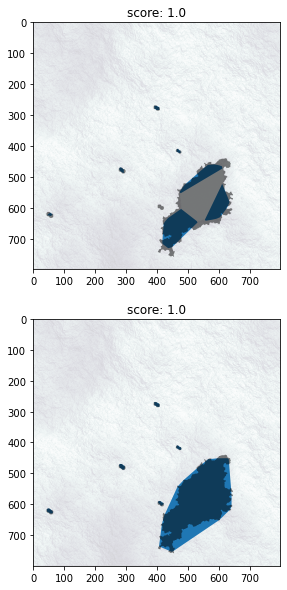
[16]:
| tpr | fpr | geom | |
|---|---|---|---|
| [{'nfeatures': 500, 'scaleFactor': 1.5, 'nlevels': 3}\n {'min_samples': 10, 'max_eps': 20, 'eps': 0.5, 'xi': 0.5}] | 1 | 0 | (POLYGON ((587 460, 569.25 461.25, 564 462, 55... |
| [{'nfeatures': 2000, 'scaleFactor': 1.5, 'nlevels': 3}\n {'min_samples': 10, 'max_eps': 20, 'eps': 0.5, 'xi': 0.5}] | 1 | 0 | (POLYGON ((628 451, 595.5 451.5, 565.5 454.5, ... |
Blob
Detector desgined to find boulders. This works by detecting pairs of light and dark areas and correlates them with the expected sub solar azimuth angle to determine candidate pairs of lit and shadowed areas. Small brightened blobs with a nearby dark blob that are colinear to the subsolar azimuth is expected to be a boulder. The boulder is flagged as a change if it not in the same location in the before image as the after image.
Pros: * Good at detecting boulders (though off by a few pixels…) * faster than other algorithms
Cons: * Does not detect large change * sensative to bad registration
Generate CD Parameters
[10]:
# Change Based on Algorithm
subtractive = [True]
min_sigma = [.25]
max_sigma = [.35, 1]
num_sigma = [4]
threshold = [.3]
overlap = [.5]
n_neighbors = [2]
angle_tolerance = [4]

function_params = [dict(zip(["subtractive", "min_sigma", "max_sigma", "num_sigma", "threshold",
                              "overlap", "n_neighbors", "angle_tolerance"],
                             ps)) for ps in cartesian_product(subtractive, min_sigma, max_sigma, num_sigma, threshold,
                              overlap, n_neighbors, angle_tolerance)]
[12]:
def image_diff_abs(arr1, arr2):
     return np.abs(cd.image_diff(arr1, arr2))

results = [cd.blob_detector(before_image,
                            after_image,
                            np.full(before_image.shape, 210),
                            **params) for params in function_params]

results
[12]:
[(                    geometry
  0     POINT (53.000 615.000)
  1    POINT (458.000 707.000)
  2    POINT (399.000 276.000)
  3    POINT (436.000 719.000)
  4    POINT (441.000 704.000)
  ..                       ...
  287  POINT (589.000 552.000)
  288  POINT (545.000 614.000)
  289  POINT (608.000 499.000)
  290  POINT (557.000 582.000)
  291  POINT (511.000 592.000)

  [292 rows x 1 columns],
  array([[3, 2, 2, ..., 0, 0, 1],
         [4, 0, 2, ..., 0, 0, 0],
         [4, 0, 2, ..., 1, 2, 0],
         ...,
         [5, 0, 0, ..., 4, 4, 0],
         [5, 0, 0, ..., 3, 3, 0],
         [1, 1, 1, ..., 1, 1, 2]], dtype=uint8)),
 (                    geometry
  0     POINT (53.000 615.000)
  1    POINT (458.000 707.000)
  2    POINT (399.000 276.000)
  3    POINT (436.000 719.000)
  4    POINT (423.000 712.000)
  ..                       ...
  287  POINT (589.000 552.000)
  288  POINT (545.000 614.000)
  289  POINT (608.000 499.000)
  290  POINT (557.000 582.000)
  291  POINT (511.000 592.000)

  [292 rows x 1 columns],
  array([[3, 2, 2, ..., 0, 0, 1],
         [4, 0, 2, ..., 0, 0, 0],
         [4, 0, 2, ..., 1, 2, 0],
         ...,
         [5, 0, 0, ..., 4, 4, 0],
         [5, 0, 0, ..., 3, 3, 0],
         [1, 1, 1, ..., 1, 1, 2]], dtype=uint8))]
[13]:
blob_results = compute_cd_metrics(results, function_params, True)
blob_results
290 6
290 6
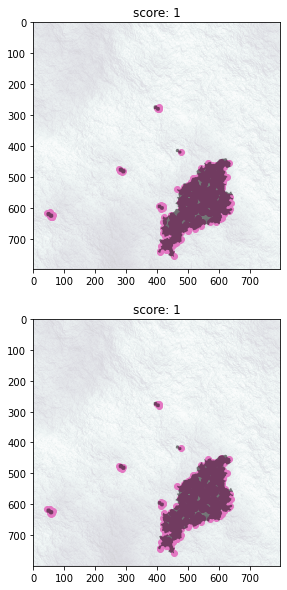
[13]:
| tpr | fpr | geom | |
|---|---|---|---|
| {'subtractive': 0, 'min_sigma': 0.25, 'max_sigma': 0.35, 'num_sigma': 4, 'threshold': 0.3, 'overlap': 0.5, 'n_neighbors': 2, 'angle_tolerance': 4} | 1 | 0.00684932 | (POINT (53 615), POINT (458 707), POINT (399 2... |
| {'subtractive': 0, 'min_sigma': 0.25, 'max_sigma': 1.0, 'num_sigma': 4, 'threshold': 0.3, 'overlap': 0.5, 'n_neighbors': 2, 'angle_tolerance': 4} | 1 | 0.00684932 | (POINT (53 615), POINT (458 707), POINT (399 2... |
[ ]:
[ ]: